Know what changed, ranked
Every movement in your business, ordered by how much of the total change it accounts for.
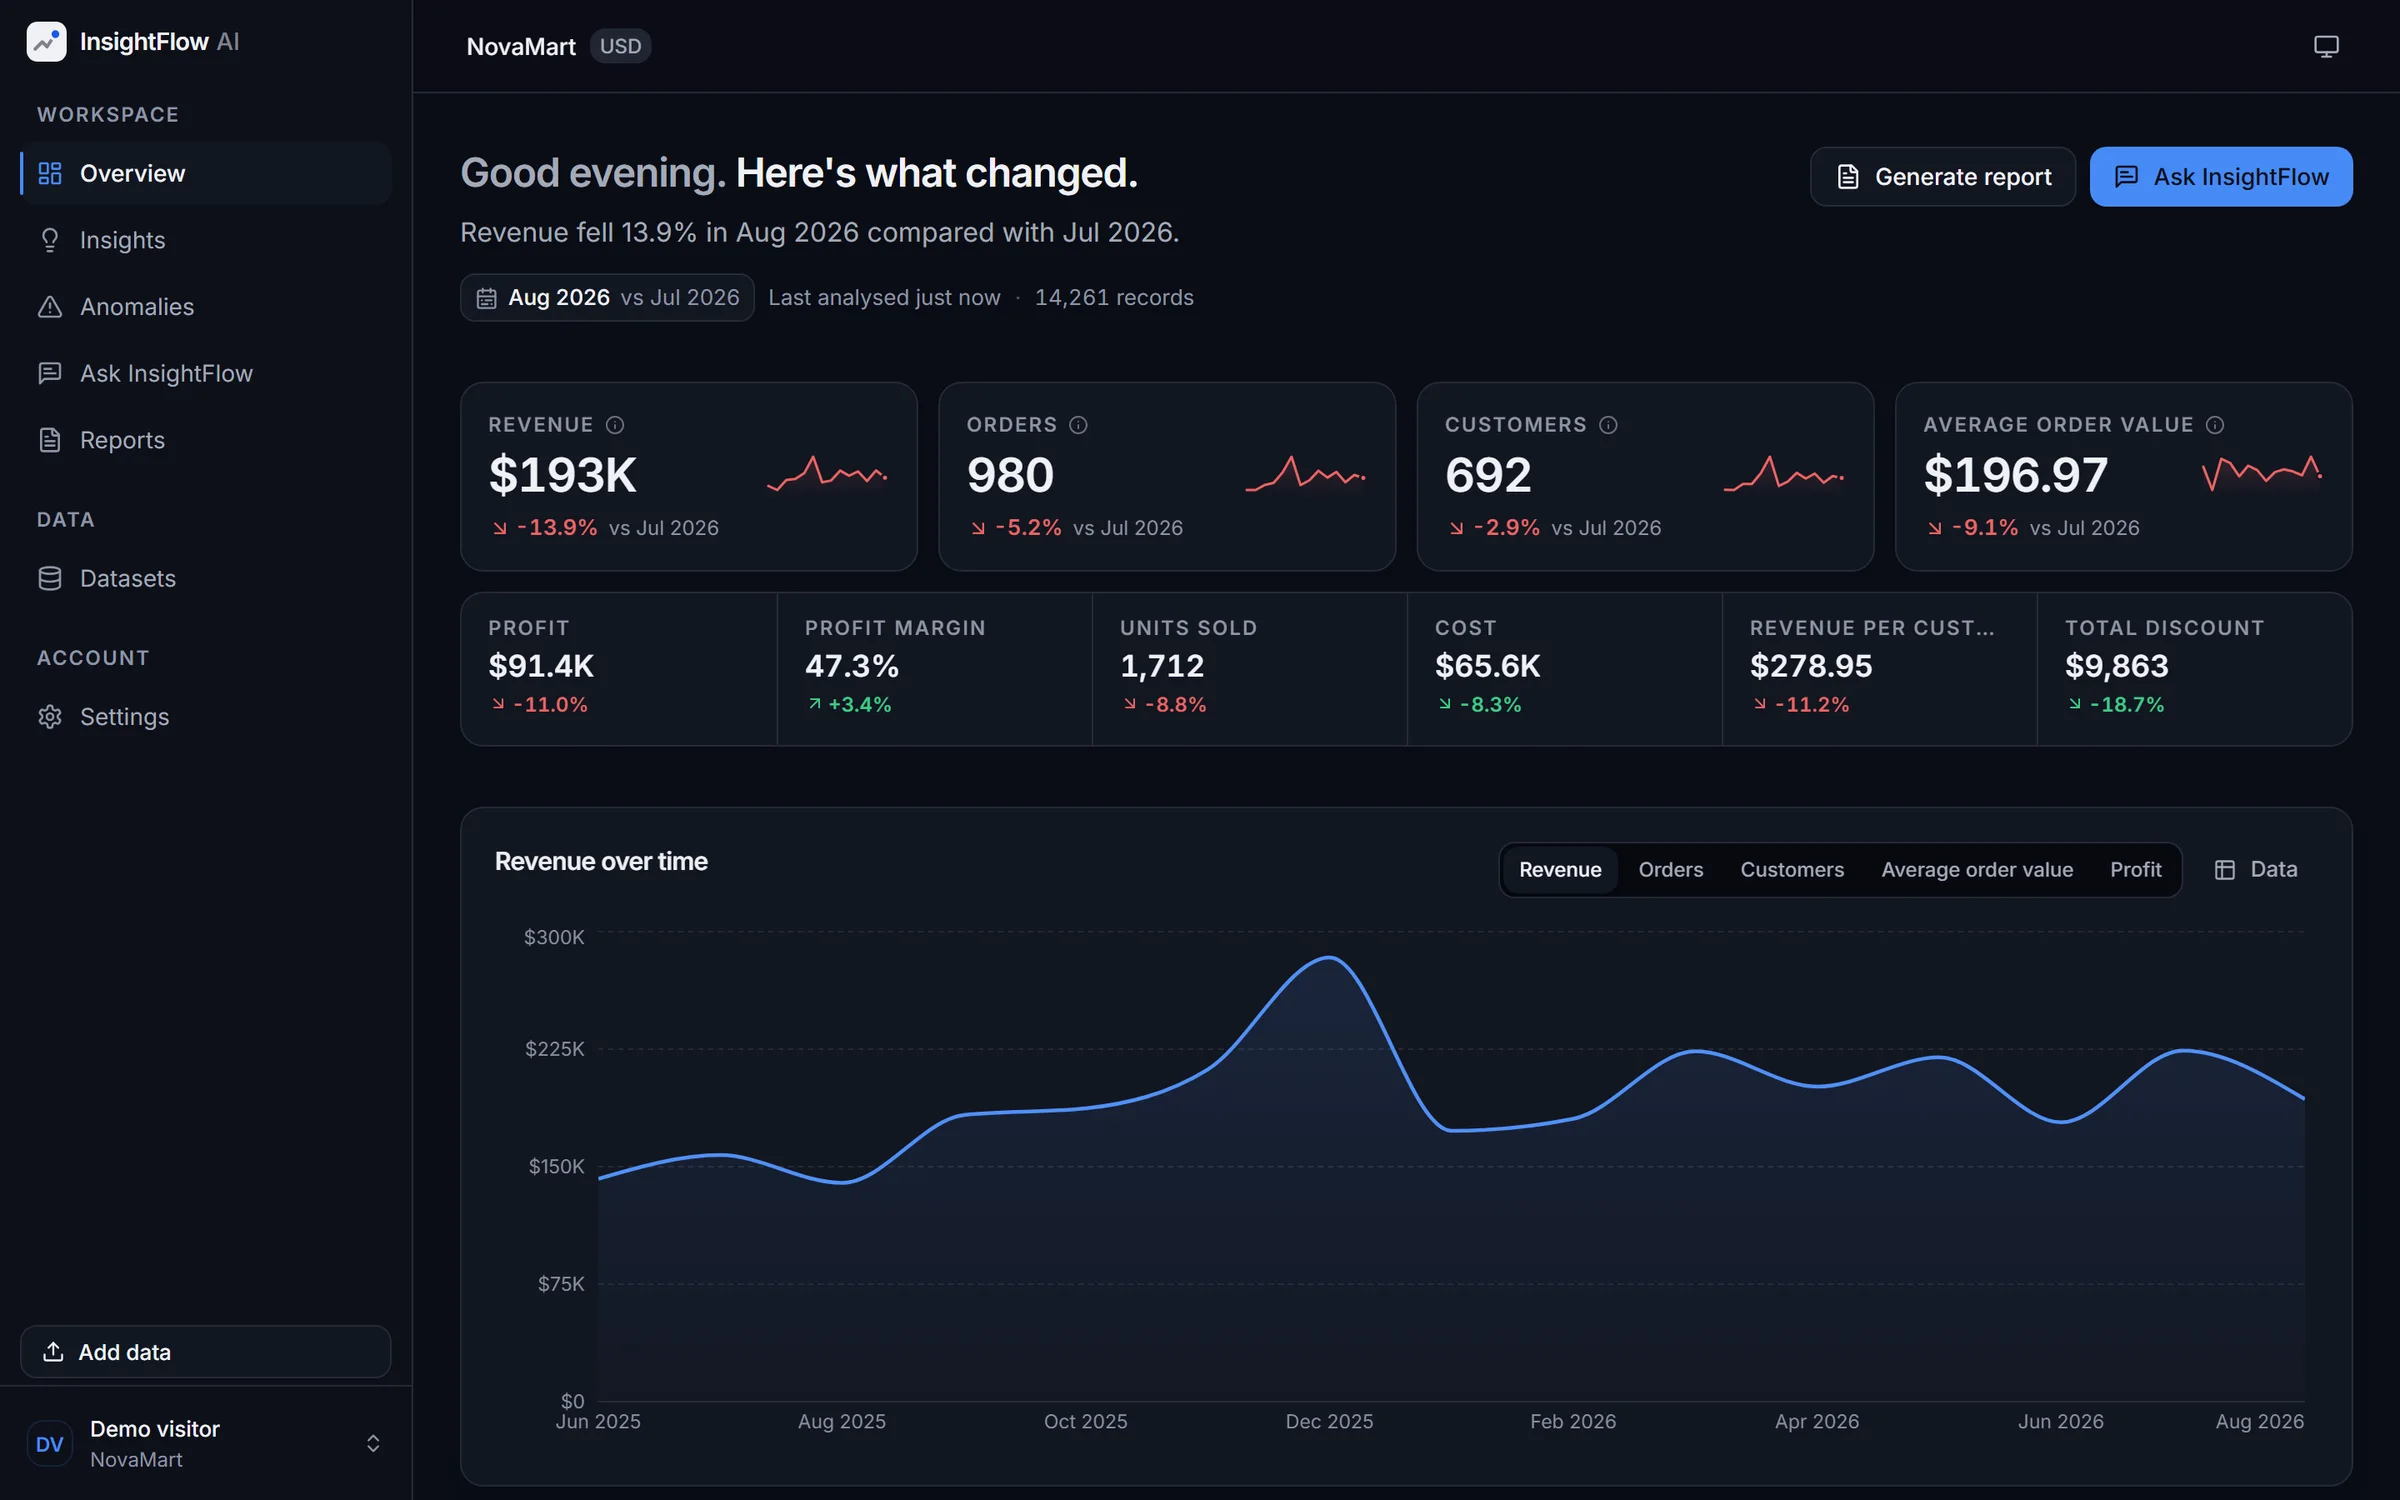
Upload your business data, discover what changed, investigate why it changed, and ask questions answered with evidence from your own figures.
Works with CSV and Excel exports. Every figure computed, never generated.
E-commerce teams
Order exports
Agencies
Client reporting
Founders
Board updates
Operators
Weekly reviews
Growing teams
Month-end close
You can see that something changed. Finding out what takes a week of pivot tables, a dashboard that shows what but never why, and a chatbot that cannot add up. InsightFlow does the analysis an analyst would — and shows the working.
The product
Every number is computed from your data by a deterministic engine. The AI puts those numbers into plain English — it never produces them.
Every movement in your business, ordered by how much of the total change it accounts for.
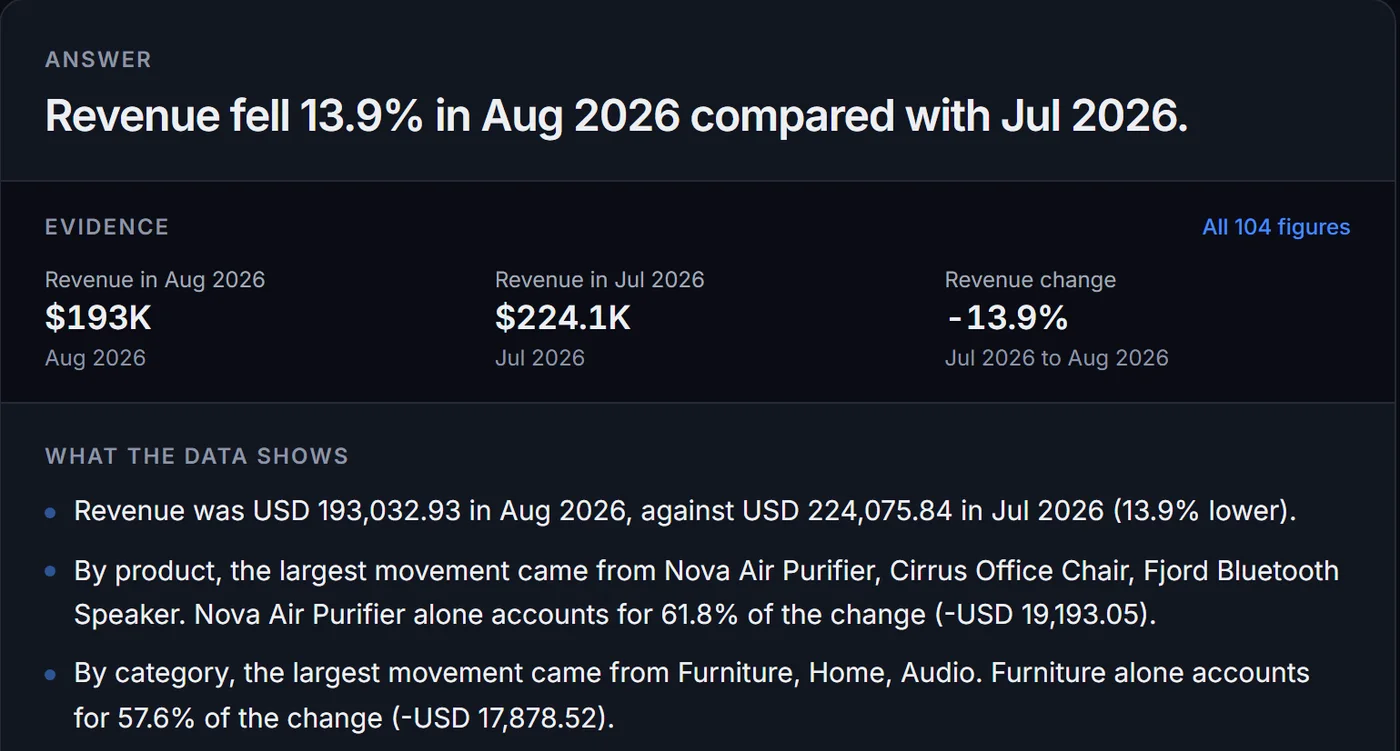
Answers arrive with the figures behind them — computed from your data and open to inspection.
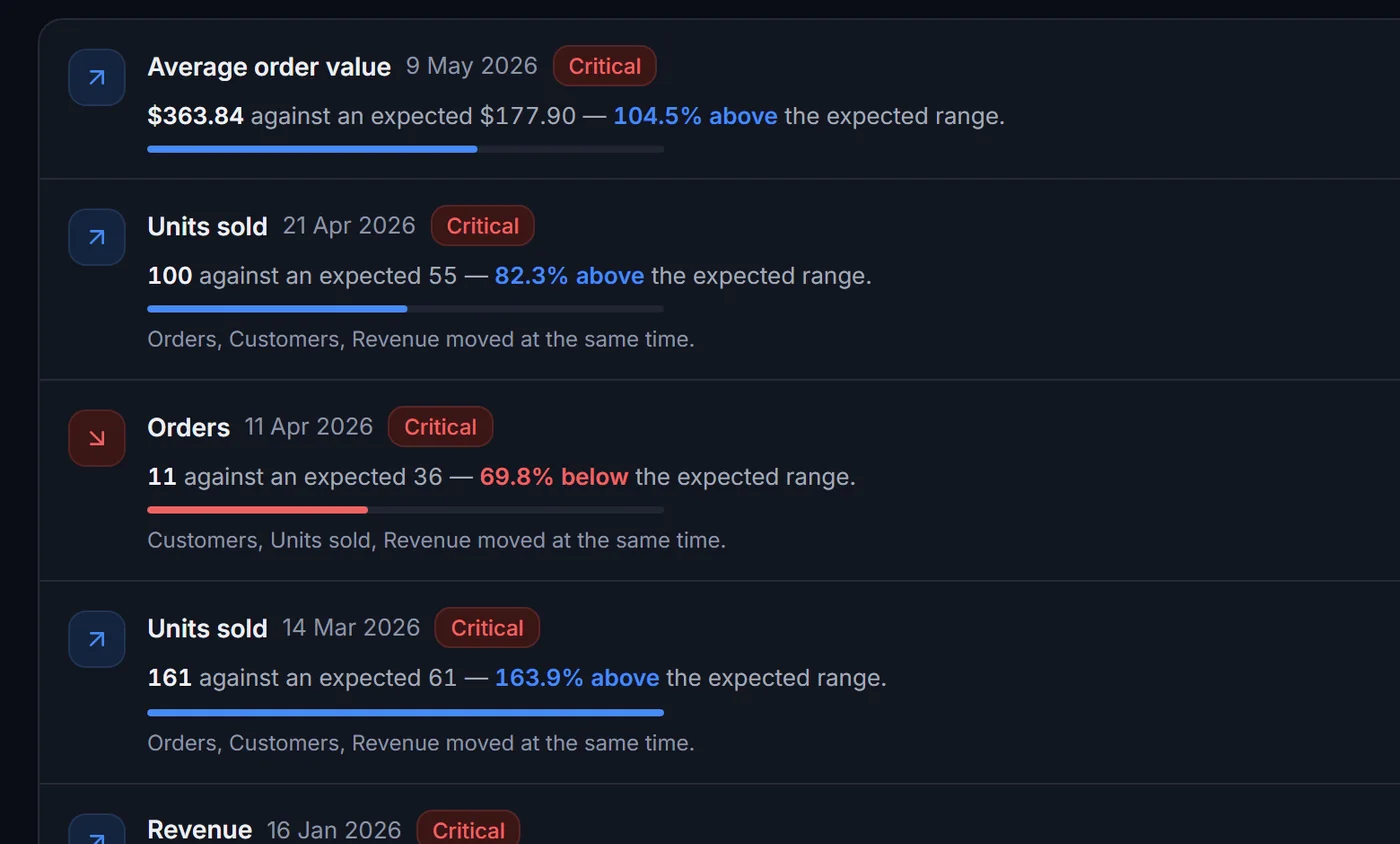
Rolling statistics, interquartile ranges and isolation forests — each applied only where it fits.
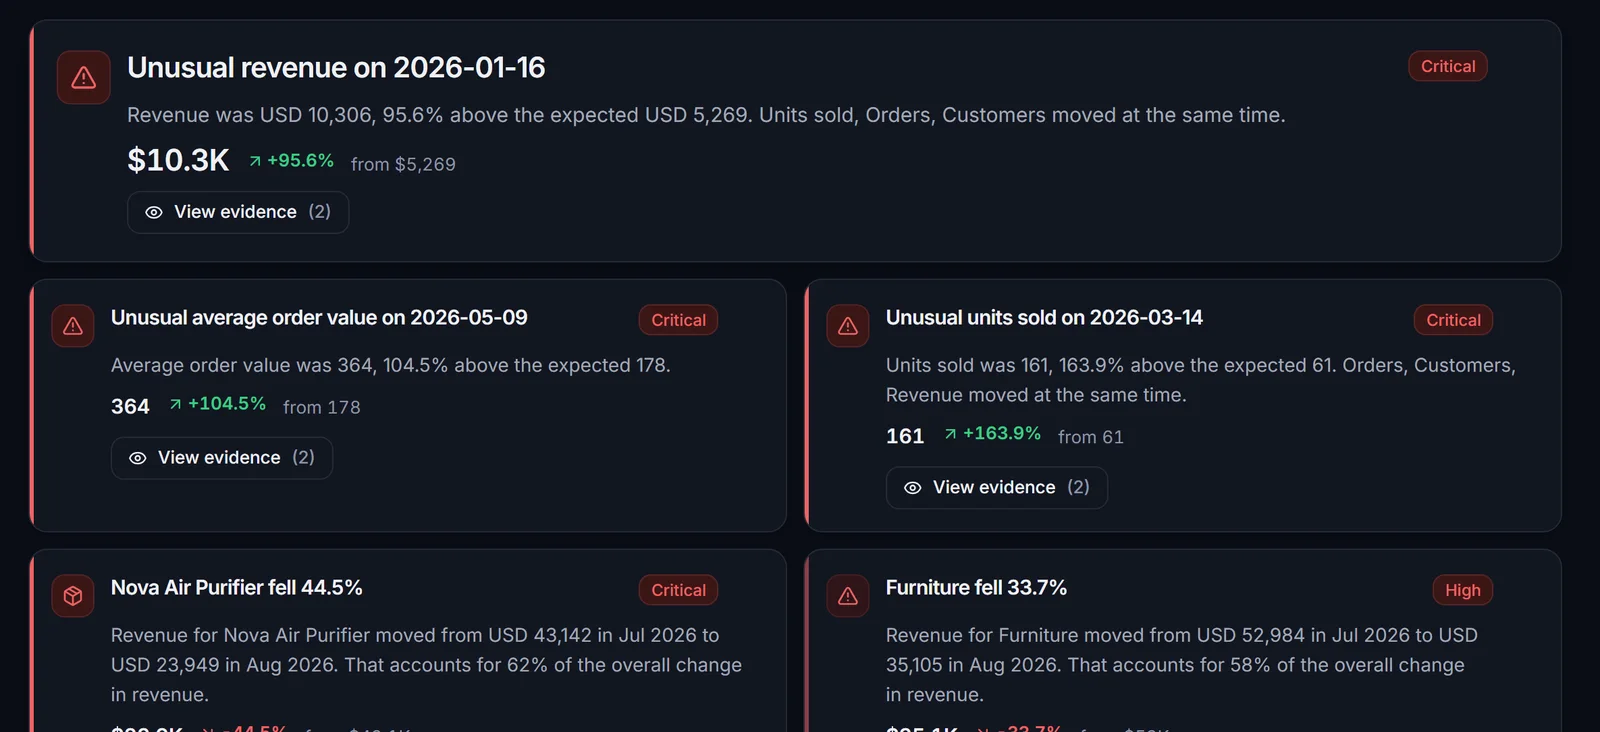
Open any anomaly to see which channel, product or region moved — and what moved with it.
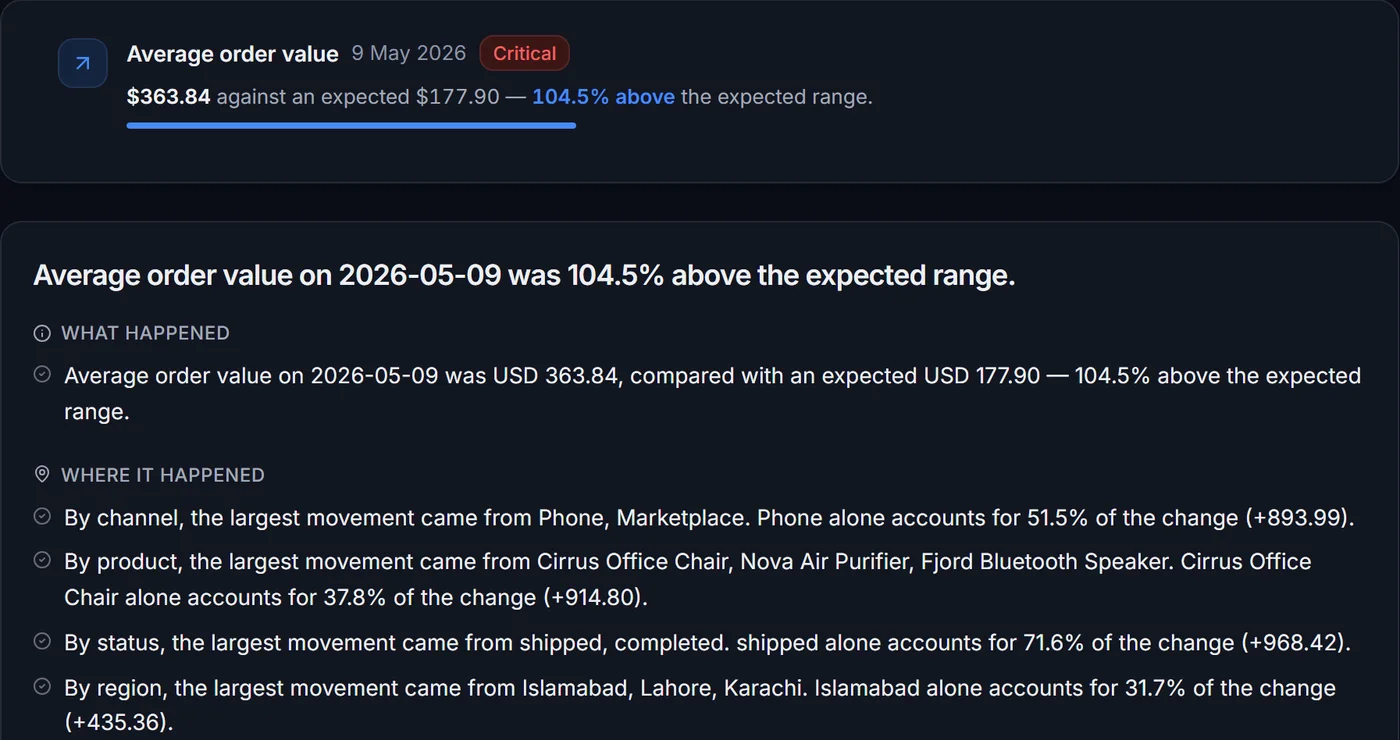
Summary, key figures and trends, fixed at generation so they never move under you.
The calculation, column, period and row count behind each number, one click away.
Analysis, anomalies and reports all run without a model. The test suite proves it.
How it works
CSV or Excel. We show you what each column was read as before anything runs.
Metrics, trends, segments and anomalies — only where your columns support them.
Every change ranked by how much of the total it accounts for.
Drill into any finding and ask follow-ups in plain English.
Why this is not an AI wrapper
Language models cannot reliably add up thousands of rows, and a confident wrong number is worse than none. So every figure is computed first, and the model only phrases it.
Your file
Rows never leave this step
Analytics engine
Computes every figure
Evidence bundle
Aggregates and labels only
Language model
Phrases what was found
Verifier
Discards unsupported figures
Your answer
Evidence attached
What people bring it
The engine reports the metrics your columns support, and says plainly which ones they don't.
Security
The AI receives computed metrics and segment names — never the rows of your file.
The default setup uses a local model, so nothing leaves your machine at all.
Access is enforced in the backend on every request, not just in the interface.
Settings shows the active AI provider and exactly what is transmitted to it.
InsightFlow AI holds no SOC 2, ISO 27001, HIPAA, or GDPR certification. We describe the controls that exist rather than claiming ones that do not.
FAQ
A CSV, TSV, or Excel export with one row per order or transaction. It needs a date and an amount; everything else is optional and adds detail. We handle the usual export problems — title rows above the headers, duplicate column names, currency symbols, mixed date formats, and unusual encodings — and tell you plainly when something cannot be read.
No, and this is the most important thing about the product. Every figure is computed in Python by a deterministic engine that is tested against datasets with hand-verified answers. The model receives those computed findings and writes them up. Anything it produces is then checked back against them, and a response citing a figure the analysis never produced is discarded rather than shown to you.
Aggregated metrics, segment names such as product and region labels, period labels, the calculation used for each figure, and your question. Individual rows of your file are never sent. With the default local model nothing leaves the machine at all, and the Settings page shows the active provider and exactly what is transmitted to it.
The product keeps working. Analysis, metrics, trends, anomalies, investigations, and reports are all produced without a model; the explanations are written by the engine instead, in plainer prose. The entire test suite runs this way, which is how we know the claim holds.
It will tell you what changed, where, by how much, and what else moved at the same time — and it will label that as coincidence, because co-occurrence is what the data establishes. If sales fell during days when inventory read zero, it reports both facts, says they coincide, and gives you a confidence level. It will not tell you one caused the other, because your spreadsheet cannot show that.
Every insight, anomaly, and answer carries a View evidence control. Opening it shows the underlying figure, the column it came from, the period, the row count, and the named calculation that produced it.
Each workspace is isolated, and access is enforced in the backend on every request rather than hidden in the interface. You can delete a dataset and its analyses at any time, and the files go with it. We make no compliance certification claims: InsightFlow AI holds no SOC 2, ISO 27001, HIPAA, or GDPR certification, and says so rather than implying otherwise.
Seconds for a typical export — the dashboard shows the real stages as they complete rather than an invented percentage. Written explanations take longer when a model runs locally on a CPU, so the evidence is shown as soon as it exists and the prose arrives when it is ready.
Explore a full analysis right now, or bring your own export and have one in under a minute.
The demo needs no account. Nothing you do in it affects anyone else.